|
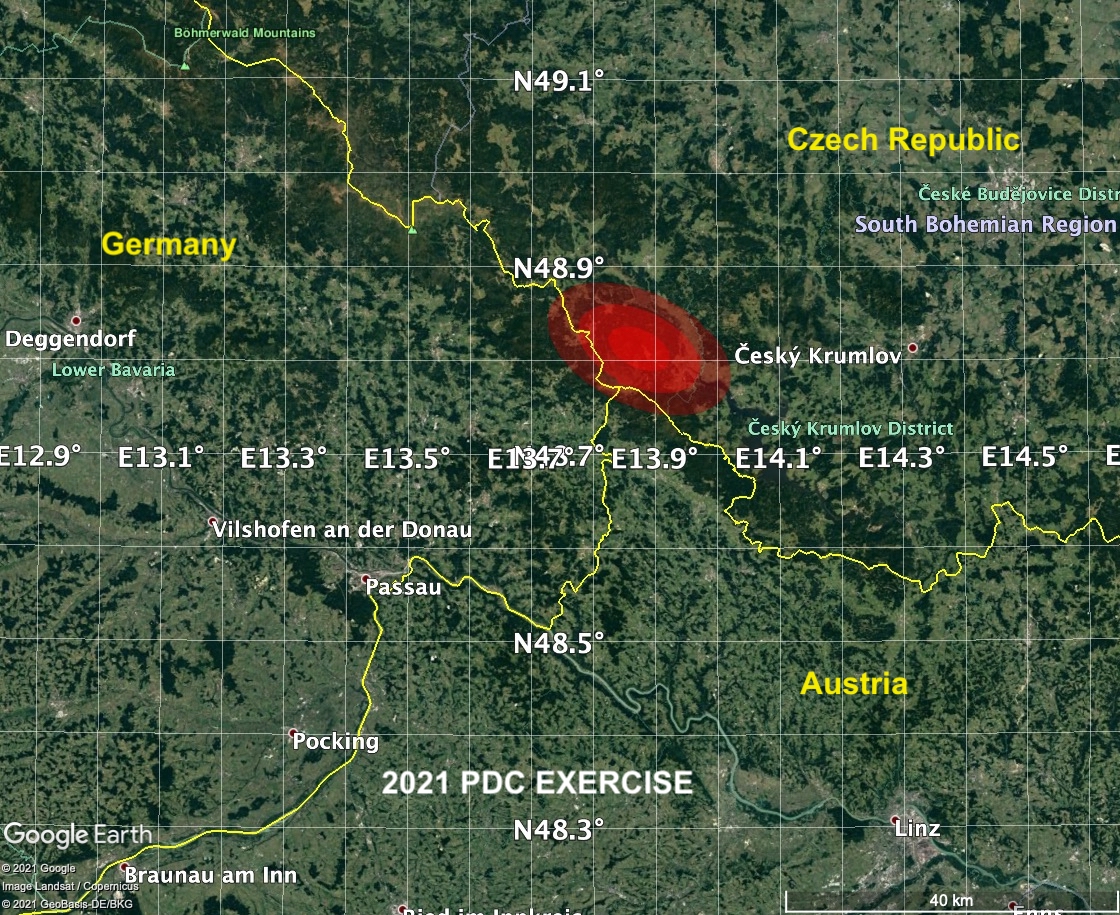
| The shaded regions in this image show where the impact is most likely to occur. There is a 99% chance the impact will be located within the outer contour, 87% inside the middle contour, and 40% inside the central dark red region. |

|
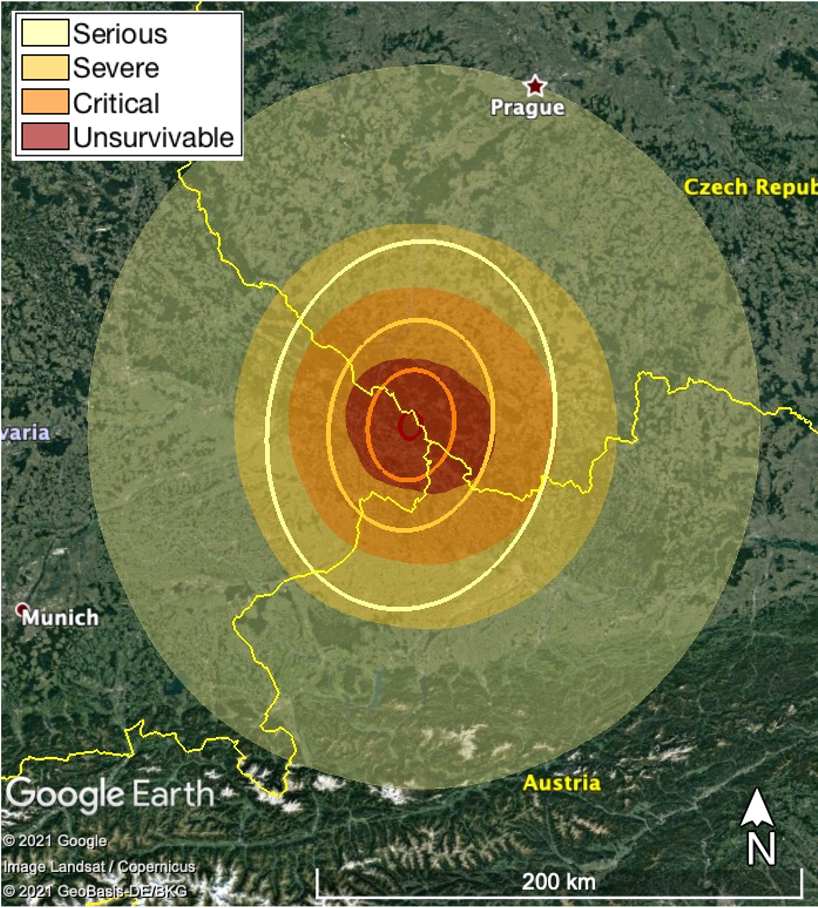
| This image shows the full range of regions potentially at risk to local ground damage from all modeled cases (shaded regions). The line contours correspond to the average damage risk case. |